meta data for this page
Iron Precipitation Project (IPP)
This project is carried out by Mengyuan Cai, Minghao Qiu, and Yichen Xu, instructed by Prof. Dr. rer. nat. Dipl.-Hydr. Külls and M. Eng. v.Grafenstein.
<latex>NO_3^-</latex>
The task is to determine the reason and the quantity of iron precipitation in a given water sample from an aquifer, and, perhaps, provide some possible solutions.
Ion balance and activity
In order to examine the result given by the document, ion balances and activity of ions are recalculated.
The calculation example for ion balance of Brunnen 07 Filter 1 Time 1(abbreviated as F1T1) is given as follows.
| Ion | Molar mass (mg/l) | Mass concentration (mg/l) |
|---|---|---|
| Anion | ||
| Chloride(Cl-) | 35.453 | 16.1 |
| Nitrite(NO2-) | 46.006 | 0.01 |
| Nitrate(NO3-) | 62.005 | 0.10 |
| Sulfate(SO42-) | 96.063 | 16.5 |
| Bicarbonate(HCO3-) | 61.017 | 297.2 |
| Cation | ||
| Sodium(Na+) | 22.990 | 9.05 |
| Ammonium(NH4+) | 18.038 | 0.10 |
| Potassium(K+) | 39.098 | 1.70 |
| Calcium(Ca2+) | 40.078 | 96.7 |
| Magnesium(Mg2+) | 24.305 | 6.60 |
| Ferrous(Fe2+) | 55.845 | 0.5 |
To calculate the ion balance, anion and cation equivalent concentrations are needed.
Anion equivalent concentration $$AEC=\sum_{i=1}^n \frac{c_i*Z_i}{M_i}$$ $$=\frac{c_{Cl^-}*Z_{Cl^-}}{M_{Cl^-}}+\frac{c_{NO_2^-}*Z_{NO_2^-}}{M_{NO_2^-}}+\frac{c_{NO_3^-}*Z_{NO_3^-}}{M_{NO_3^-}}+\frac{c_{SO_4^{2-}}*Z_{SO_4^{2-}}}{M_{SO_4^{2-}}}+\frac{c_{HCO_3^-}*Z_{HCO_3^-}}{M_{HCO_3^-}}$$ $$=5.670\ meq/l$$
Cation equivalent concentration $$CEC=\sum_{i=1}^n \frac{c_i*Z_i}{M_i}$$ $$=\frac{c_{Na^+}*Z_{Na^+}}{M_{Na^+}}+\frac{c_{NH_4^+}*Z_{NH_4^+}}{M_{NH_4^+}}+\frac{c_{K^+}*Z_{K^+}}{M_{K^+}}+\frac{c_{Ca^{2+}}*Z_{Ca^{2+}}}{M_{Ca^{2+}}}+\frac{c_{Mg^{2+}}*Z_{Mg^{2+}}}{M_{Mg^{2+}}}+\frac{c_{Fe^{2+}}*Z_{Fe^{2+}}}{M_{Fe^{2+}}}$$ $$=5.829\ meq/l$$
In which c=mass concentration of ion, Z=charge of ion, M=molar mass of ion.
$$Ion\ balance=\frac{AEC-CEC}{AEC+CEC}=-1.383\%$$
To calculate activity of ions, ion strength and activity coefficients for monovalent and bivalent ions are needed.
Ion strength $$I=\frac{1}{2} \sum_{i=1}^n c_i*z_i$$ $$=c_{Cl^-}*Z_{Cl^-}+c_{NO_2^-}*Z_{NO_2^-}+c_{NO_3^-}*Z_{NO_3^-}+c_{SO_4^{2-}}*Z_{SO_4^{2-}}+c_{HCO_3^-}*Z_{HCO_3^-}$$ $$+c_{Na^+}*Z_{Na^+}+c_{NH_4^+}*Z_{NH_4^+}+c_{K^+}*Z_{K^+}+c_{Ca^{2+}}*Z_{Ca^{2+}}+c_{Mg^{2+}}*Z_{Mg^{2+}}+c_{Fe^{2+}}*Z_{Fe^{2+}}$$ $$=8.6148*10^{-3}\ eq/l$$
In which c=molar concentration of ion.
To calculate the activity coefficient, Debye-Hückel equation is used.
$$log{\gamma_i}=-\frac{A*Z_i^2*\sqrt{I}}{1+a_i*B*\sqrt{I}}$$
In which A=0.4960, B=0.3258*10-8 at 10°C, and the values of ai are shown as follows.
| a0 (*108) | Ion |
|---|---|
| 2.5 | NH4+ |
| 3 | K-, Cl-, NO3- |
| 4 | SO42+ |
| 4.0-4.5 | Na+, HCO3- |
| 6 | Ca2+, Fe2+ |
| 8 | Mg2+ |
| 9 | Fe3+ |
Since the ai value of NO2- is missing in the table, the ai value of NO3- is used instead. Moreover, the ai value of Na+, HCO3- is chosen as 4.25 since the error caused by the ai value is not significant.
The calculated activity coefficients of ions are as follows.
| Activity coefficient γ | |
|---|---|
| NH4+ | 0.90614759 |
| K-, Cl-, NO3-, NO2- | 0.90738638 |
| SO42+ | 0.68505193 |
| Na+, HCO3- | 0.91034496 |
| Ca2+, Fe2+ | 0.69844622 |
| Mg2+ | 0.71076069 |
| Fe3+ | 0.71655243 |
Results of activity of ions are as follows.
| Ion | Activity (mol/l) |
|---|---|
| Chloride(Cl-) | 4.12064*10-4 |
| Nitrite(NO2-) | 1.97232*10-7 |
| Nitrate(NO3-) | 1.46341*10-6 |
| Sulfate(SO42-) | 1.17666*10-4 |
| Bicarbonate(HCO3-) | 4.43408*10-3 |
| Sodium(Na+) | 3.58357*10-4 |
| Ammonium(NH4+) | 5.02355*10-6 |
| Potassium(K+) | 3.94536*10-5 |
| Calcium(Ca2+) | 1.68521*10-3 |
| Magnesium(Mg2+) | 1.93006*10-4 |
| Ferrous(Fe2+) | 6.25344*10-6 |
The results of all calculations are as follows.
The results of ion balance calculations are as follows.
| Br7 T1 | Br7 T2 | Br7 T4 | |
|---|---|---|---|
| -2.74% | -1.83% | -2.39% | |
| F1 T1 | F1 T2 | F1 T3 | F1 T4 |
| -1.38% | -1.56% | -1.95% | -2.25% |
| F2 T1 | F2 T2 | F2 T3 | F2 T4 |
| -2.24% | -2.90% | -2.14% | -2.25% |
The results of activity calculations are as follows.
| Activity a (mol/l) | Br7 T1 | Br7 T2 | Br7 T4 |
|---|---|---|---|
| Chloride(Cl-) | 3.33531*10-4 | 3.13601*10-4 | 3.15872*10-4 |
| Nitrite(NO2-) | 1.97714*10-7 | 1.98089*10-7 | 1.97902*10-7 |
| Nitrate(NO3-) | 2.14177*10-5 | 5.14414*10-5 | 5.13927*10-5 |
| Sulfate(SO42-) | 1.54051*10-4 | 1.35587*10-4 | 1.35823*10-4 |
| Bicarbonate(HCO3-) | 4.24256*10-3 | 4.18718*10-3 | 4.24633*10-3 |
| Sodium(Na+) | 4.00871*10-4 | 3.50689*10-4 | 3.38858*10-4 |
| Ammonium(NH4+) | 5.03583*10-6 | 6.05480*10-6 | 7.05706*10-6 |
| Potassium(K+) | 2.62886*10-5 | 4.14890*10-5 | 4.28469*10-5 |
| Calcium(Ca2+) | 1.63862*10-3 | 1.57850*10-3 | 1.61396*10-3 |
| Magnesium(Mg2+) | 2.27352*10-4 | 2.12972*10-4 | 2.25064*10-4 |
| Iron(Fe2+) | 1.23654*10-5 | 1.43509*10-5 | 1.40513*10-5 |
| Activity a (mol/l) | F1 T1 | F1 T2 | F1 T3 | F1 T4 |
|---|---|---|---|---|
| Chloride(Cl-) | 4.12064*10-4 | 4.19508*10-4 | 4.19766*10-4 | 4.17044*10-4 |
| Nitrite(NO2-) | 1.97232*10-7 | 1.97122*10-7 | 1.97243*10-7 | 1.97167*10-7 |
| Nitrate(NO3-) | 1.46341*10-6 | 1.46259*10-6 | 1.46349*10-6 | 1.46292*10-6 |
| Sulfate(SO42-) | 1.17666*10-4 | 1.21687*10-4 | 1.20544*10-4 | 1.20367*10-4 |
| Bicarbonate(HCO3-) | 4.43408*10-3 | 4.45861*10-3 | 4.37015*10-3 | 4.39542*10-3 |
| Sodium(Na+) | 3.58357*10-4 | 3.53420*10-4 | 3.57187*10-4 | 3.59829*10-4 |
| Ammonium(NH4+) | 5.02355*10-6 | 5.02066*10-6 | 5.02383*10-6 | 5.02183*10-6 |
| Potassium(K+) | 3.94536*10-5 | 3.71120*10-5 | 3.71348*10-5 | 3.78165*10-5 |
| Calcium(Ca2+) | 1.68521*10-3 | 1.68547*10-3 | 1.67681*10-3 | 1.69200*10-3 |
| Magnesium(Mg2+) | 1.93006*10-4 | 2.12817*10-4 | 2.01813*10-4 | 2.05078*10-4 |
| Iron(Fe2+) | 6.25344*10-6 | 1.12347*10-5 | 1.12583*10-5 | 1.12434*10-5 |
| Activity a (mol/l) | F2 T1 | F2 T2 | F2 T3 | F2 T4 |
|---|---|---|---|---|
| Chloride(Cl-) | 2.17596*10-4 | 2.14859*10-4 | 2.17818*10-4 | 2.20081*10-4 |
| Nitrite(NO2-) | 1.98207*10-7 | 1.99200*10-7 | 1.99308*10-7 | 1.99263*10-7 |
| Nitrate(NO3-) | 5.29430*10-6 | 1.47801*10-6 | 1.47881*10-6 | 1.47847*10-6 |
| Sulfate(SO42-) | 1.13653*10-4 | 1.22435*10-4 | 1.23461*10-4 | 1.22466*10-4 |
| Bicarbonate(HCO3-) | 4.03852*10-3 | 3.93684*10-3 | 3.92003*10-3 | 3.93779*10-3 |
| Sodium(Na+) | 3.09254*10-4 | 2.98214*10-4 | 3.02365*10-4 | 3.01897*10-4 |
| Ammonium(NH4+) | 5.05292*10-6 | 5.05517*10-6 | 7.58737*10-6 | 7.58544*10-6 |
| Potassium(K+) | 3.59861*10-5 | 4.06768*10-5 | 4.21038*10-5 | 4.06905*10-5 |
| Calcium(Ca2+) | 1.86997*10-3 | 1.84082*10-3 | 1.80729*10-3 | 1.82069*10-3 |
| Magnesium(Mg2+) | 2.61300*10-4 | 2.57208*10-4 | 2.45161*10-4 | 2.47395*10-4 |
| Iron(Fe2+) | 1.31731*10-6 | 2.10847*10-5 | 2.20841*10-5 | 2.17499*10-5 |
Visualization
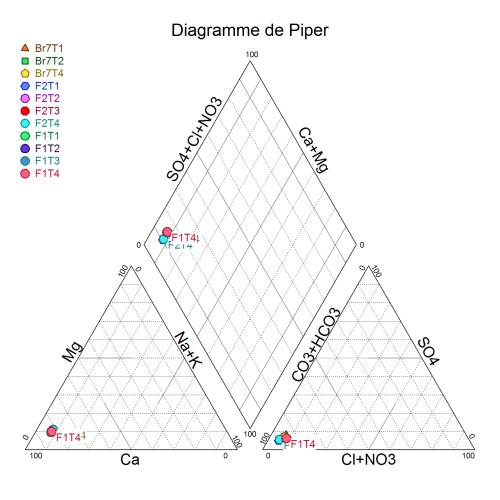
This is the Piper Diagram of all samples. It shows that all the water samples have a relatively high consistency, which means the water at the sampling site is highly homogeneous.
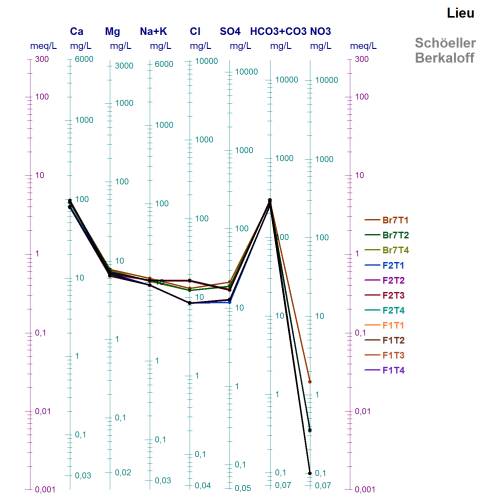
This is the Schoeller Diagram of all samples. It shows that although the water is highly homogeneous, there are differences between the Cl- and SO42- concentration of Filter 1 and Filter 2.
Redox potential
Due to the absence of data of Fe3+ concentration, assumptions are needed when doing the following calculations. Thus, 3 assumptions are made as follows.
1. Since every device has its detecting limit, it is possible that the Fe3+ could be just below the detecting threshold.
2. Since there is iron precipitation in the water sample, it is also possible that all the iron precipitation contains Fe3+, which are all previously dissolved in the water.
3. It is reasonable to assume that the Fe3+ concentration is dissolved part of Fe(OH)3 in the water at equilibrium.
According to the calculations, the first two assumptions are not likely to be true because the pe value is too high, which is high enough to cause the dissociation of water itself. Therefore, only the methodology of calculation and result is given as follows.
F1 T1 is taken as an example.
$$[Fe^{3+}]=\frac{K_{sp}}{[OH^-]^3}=\frac{1.1*10^{-36}}{10^{-(14.534617-7.2)*3}}=1.1098*10^{-14}\ mol/l$$
In which Ksp=1.1*10-36 is the solubility product at 18°C because the solubility product at 10°C is not available, and 10-14.534617 is the ion product of water at 10°C.
$$pe=pe^0+\log \frac{[Fe^{3+}]}{[Fe^{2+}]}=13+\log \frac{1.1098*10^{-14}}{6.25344*10^{-6}}=4.2491$$
In which pe0=13 is the standard pe at 25°C because the standard pe at 10°C is not available.
The results of all redox potential calculations are as follows.
| Br7 T1 | Br7 T2 | Br7 T4 | |
|---|---|---|---|
| 3.3530 | 3.2884 | 3.2975 | |
| F1 T1 | F1 T2 | F1 T3 | F1 T4 |
| 4.2491 | 3.9947 | 3.9938 | 3.9943 |
| F2 T1 | F2 T2 | F2 T3 | F2 T4 |
| 4.9256 | 3.7213 | 3.7012 | 3.7078 |
Carbon balance
In order to obtain the activity of CO32-, which might be responsible for the precipitation of Calcite, Dolomite, and Siderite, the carbon balance is calculated.
The calculation example of carbon balance of F1 T1 is given as follows.
$$CO_2(g) + H_2O \rightleftharpoons H_2CO_3$$
$$K_0=\frac {[H_2CO_3]}{[CO_2]}=5.37*10^{-2}$$
$$H_2CO_3 \rightleftharpoons H^+ + HCO_3^-$$
$$K_1=\frac {[H^+][HCO_3^-]}{[H_2CO_3]}=3.47*10^{-7}$$
$$HCO_3^- \rightleftharpoons H^+ + CO_3^{2-}$$
$$K_2=\frac {[H^+][CO_3^{2-}]}{[HCO_3^-]}=2.75*10^{-11}$$
The activity of HCO3- is calculated previously.
$$[HCO_3^-]=4.43408*10^{-3}\ mol/l$$
Therefore, $$[CO_2(g)]=1.50*10^{-2}\ mol/l$$
$$[H_2CO_3]=8.07*10^{-4}\ mol/l$$
$$[CO_3^{2-}]=1.94*10^{-6}\ mol/l$$
The results of all carbon balance calculations are as follows.
| Activity a (mol/l) | Br7 T1 | Br7 T2 | Br7 T4 |
|---|---|---|---|
| [CO2(g)] | 9.07*10-3 | 8.95*10-3 | 9.08*10-3 |
| [H2CO3] | 4.87*10-4 | 4.81*10-4 | 4.88*10-4 |
| [CO32-] | 2.94*10-6 | 2.90*10-6 | 2.94*10-6 |
| Activity a (mol/l) | F1 T1 | F1 T2 | F1 T3 | F1 T4 |
|---|---|---|---|---|
| [CO2(g)] | 1.50*10-2 | 1.51*10-2 | 1.48*10-2 | 1.49*10-2 |
| [H2CO3] | 8.07*10-4 | 8.11*10-4 | 7.95*10-4 | 8.00*10-4 |
| [CO32-] | 1.94*10-6 | 1.95*10-6 | 1.91*10-6 | 1.92*10-6 |
| Activity a (mol/l) | F2 T1 | F2 T2 | F2 T3 | F2 T4 |
|---|---|---|---|---|
| [CO2(g)] | 8.63*10-3 | 8.42*10-3 | 8.38*10-3 | 8.42*10-3 |
| [H2CO3] | 4.64*10-4 | 4.52*10-4 | 4.50*10-4 | 4.52*10-4 |
| [CO32-] | 2.79*10-6 | 2.72*10-6 | 2.71*10-6 | 2.72*10-6 |
Saturation indices(SI)
It is clear that not all compounds that exist in the water can form a precipitation. Therefore, only saturation indices(SI) of those that are possible to form a precipitation need to be determined. The compounds that can form a precipitation are CaCO3, MgCO3, FeCO3, Fe(OH)2, and Fe(OH)3. However, for the water samples from Filter 1 and Filter 2, when calculating the redox potential, Fe(OH)3 is assumed as at equilibrium. Thus, the SI of Fe(OH)3 of those samples are 0. As for Brunnen 07, the SI of Fe(OH)3 can be calculated.
The calculation example of saturation indices of F1 T1 is given as follows.
CaCO3 is taken as an example.
$$SI_{CaCO_3}=\log \frac{[Ca^{2+}][CO_3^{2+}]}{K_{sp}}=0.1435$$
In which Ksp=10-8.36 is the solubility product of Calcite at 10°C.
The results of all saturation indices of F1 T1 are as follows.
| Compounds | Saturation indices SI |
|---|---|
| CaCO3 | 0.1435 |
| MgCO3 | -4.5726 |
| CaSO4 | -2.4880 |
| FeCO3 | 0.0519 |
| Fe(OH)2 | -5.6880 |
The results of all saturation indices calculations are as follows.
| Saturation indices SI | Br7 T1 | Br7 T2 | Br7 T4 |
|---|---|---|---|
| CaCO3 | 0.1121 | 0.0902 | 0.1059 |
| MgCO3 | -4.5206 | -4.5547 | -4.5247 |
| CaSO4 | -2.7379 | -2.5455 | -2.5254 |
| FeCO3 | 0.3288 | 0.3878 | 0.3847 |
| Fe(OH)2 | -8.3919 | -8.3272 | -8.3364 |
| Fe(OH)3 | -0.7451 | -1.0856 | -0.9650 |
| Saturation indices SI | F1 T1 | F1 T2 | F1 T3 | F1 T4 |
|---|---|---|---|---|
| CaCO3 | 0.1435 | 0.1459 | 0.1350 | 0.1414 |
| MgCO3 | -4.5726 | -4.5278 | -4.5595 | -4.5501 |
| CaSO4 | -2.4880 | -2.4734 | -2.4797 | -2.4764 |
| FeCO3 | 0.0519 | 0.3087 | 0.3009 | 0.3029 |
| Fe(OH)2 | -5.6880 | -5.4335 | -5.4326 | -5.4332 |
| Saturation indices SI | F2 T1 | F2 T2 | F2 T3 | F2 T4 |
|---|---|---|---|---|
| CaCO3 | 0.1481 | 0.1302 | 0.1203 | 0.1255 |
| MgCO3 | -4.4816 | -4.4995 | -4.5222 | -4.5163 |
| CaSO4 | -2.4579 | -2.4324 | -2.4368 | -2.4371 |
| FeCO3 | -0.6651 | 0.5281 | 0.5463 | 0.5417 |
| Fe(OH)2 | -9.3644 | -8.1601 | -8.1400 | -8.1466 |
Modeling
Modeling with PHREEQC
After calculating all the data manually, a program called 'PHREEQC' is used to establish the models.
These models are used to investigate:
1)the saturation indices of different minerals that can exist in the water samples;
2)the sensitivity of the minerals to the change of temperature, pH, and pe;
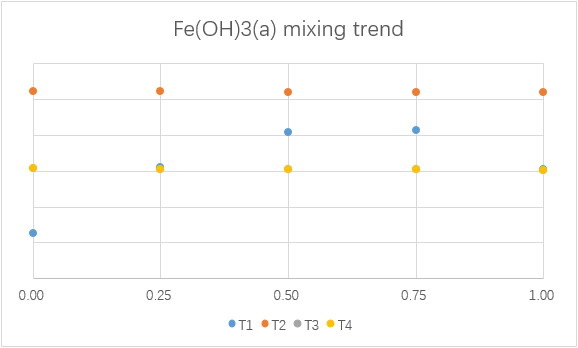
3)the results of mixing two water samples from F1 and F2 in different ratio.
(Due to the problems of PHREEQC about calculations in redox reactions, the sensitivity related to pe level will not be taken into consideration. Moreover, the results of mixing are only relative data.)
Saturation indices
| pH=7.2 | pe=2 | Calcite | Dolomite | Gypsum | Anhydrite | Siderite | Goethite | Fe(OH)3(a) | Jarosite |
|---|---|---|---|---|---|---|---|---|---|
| Br7 | T1 | -0.0692 | -1.1042 | -2.1038 | -2.5752 | 0.0763 | -1.7034 | -7.0254 | -32.3761 |
| T2 | -0.0908 | -1.1600 | -2.1727 | -2.6445 | 0.1360 | -2.0420 | -7.3626 | -33.2996 | |
| T4 | -0.0747 | -1.1128 | -2.1640 | -2.6353 | 0.1324 | -1.9237 | -7.2461 | -32.9336 | |
| F1 | T1 | -0.0276 | -1.0977 | -2.2038 | -2.6709 | -0.1941 | -0.9141 | -6.2508 | -30.0733 |
| T2 | -0.0240 | -1.0463 | -2.1902 | -2.6562 | 0.0638 | -0.9159 | -6.2566 | -30.0808 | |
| T3 | -0.0346 | -1.0882 | -2.1958 | -2.6618 | 0.0582 | -0.9158 | -6.2565 | -30.0876 | |
| T4 | -0.0283 | -1.0726 | -2.1931 | -2.6591 | 0.0596 | -0.9159 | -6.2565 | -30.0823 | |
| F2 | T1 | -0.1374 | -1.2231 | -2.3982 | -2.8642 | -1.0161 | -3.9137 | -9.2543 | -39.3805 |
| T2 | -0.1566 | -1.2634 | -2.3707 | -2.8379 | 0.1779 | -3.9119 | -9.2486 | -39.2515 | |
| T3 | -0.1656 | -1.2943 | -2.3726 | -2.8397 | 0.1972 | -3.9118 | -9.2485 | -39.2252 | |
| T4 | -0.1608 | -1.2839 | -2.3738 | -2.8410 | 0.1918 | -3.9118 | -9.2485 | -39.2486 |
Sensitivity
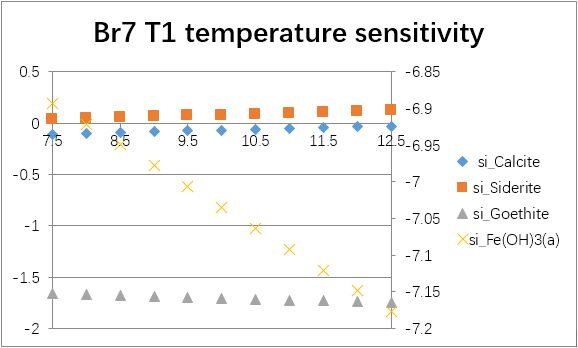
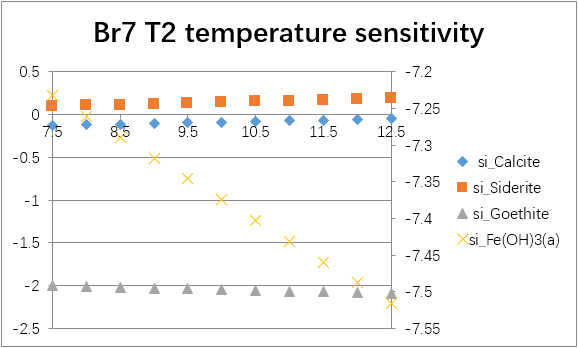
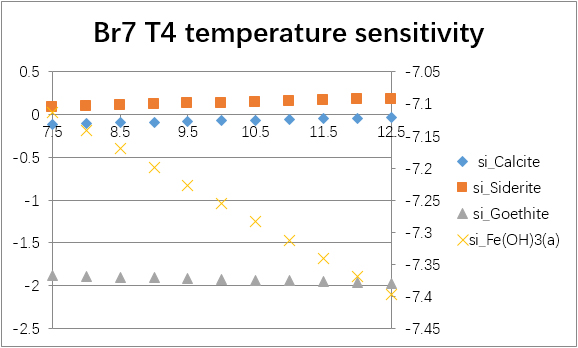
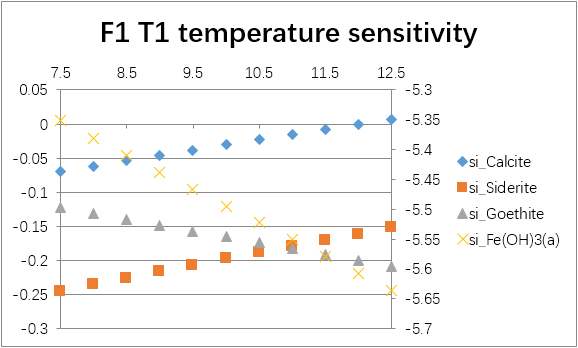
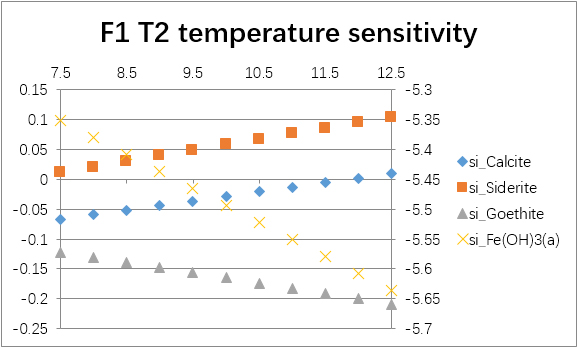
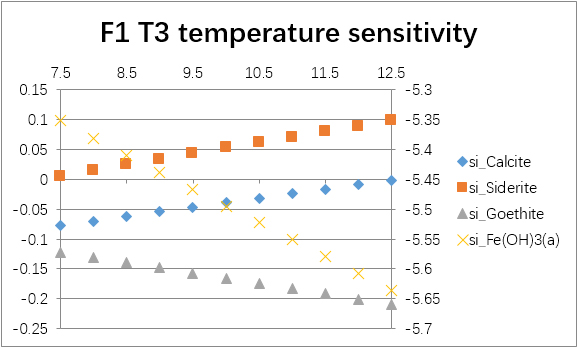
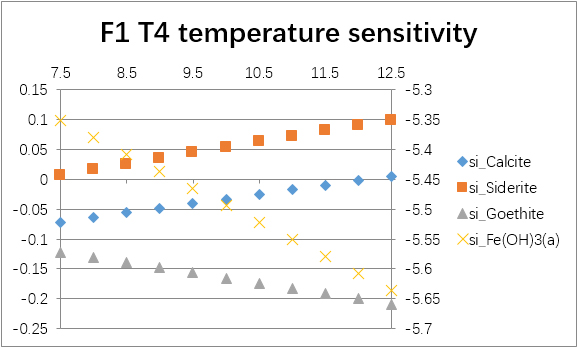
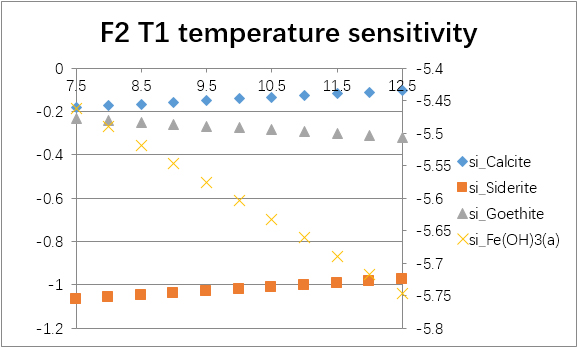
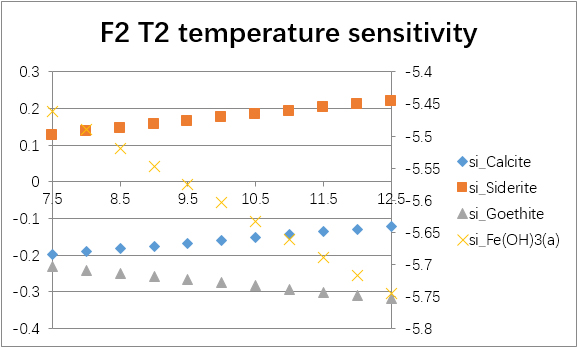
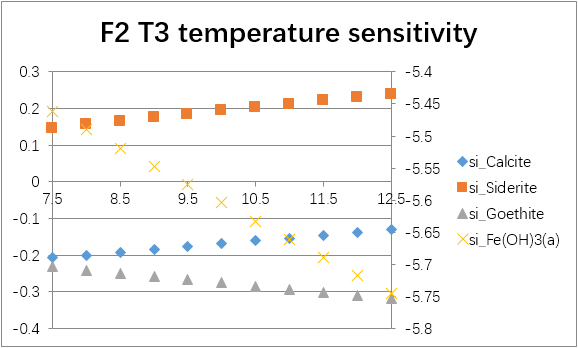
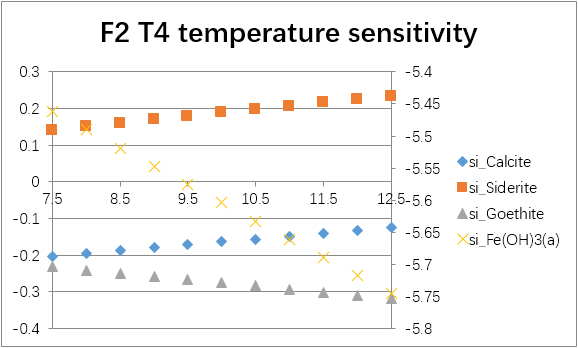
The temperature sensitivity of all water samples are shown as follows.
(For each graph, the x-axis is temperature, and the y-axes are saturation indices. The saturation indices of Fe(OH)3(a) should be read from the secondary axis.)
The pH sensitivity of all water samples are shown as follows.
| Site | Time | pH | si_Calcite | si_Siderite | si_Goethite | si_Fe(OH)3(a) |
|---|---|---|---|---|---|---|
| Br7 | T1 | 6.8 | -0.4679 | -0.3159 | -1.9537 | -7.2758 |
| 7.0 | -0.2684 | -0.1189 | -1.8176 | -7.1397 | ||
| 7.2 | -0.0692 | 0.0763 | -1.7034 | -7.0254 | ||
| 7.4 | 0.1295 | 0.2689 | -1.6127 | -6.9348 | ||
| T2 | 6.8 | -0.4895 | -0.2562 | -2.2924 | -7.6130 | |
| 7.0 | -0.2900 | -0.0592 | -2.1563 | -7.4769 | ||
| 7.2 | -0.0908 | 0.1360 | -2.0420 | -7.3626 | ||
| 7.4 | 0.1079 | 0.3286 | -1.9514 | -7.2720 | ||
| T4 | 6.8 | -0.4733 | -0.2598 | -2.1739 | -7.4963 | |
| 7.0 | -0.2739 | -0.0628 | -2.0379 | -7.3603 | ||
| 7.2 | -0.0747 | 0.1324 | -1.9237 | -7.2461 | ||
| 7.4 | 0.1240 | 0.3249 | -1.8331 | -7.1555 |
| Site | Time | pH | si_Calcite | si_Siderite | si_Goethite | si_Fe(OH)3(a) |
|---|---|---|---|---|---|---|
| F1 | T1 | 6.8 | -0.4262 | -0.5860 | -0.4180 | -5.7547 |
| 7.0 | -0.2268 | -0.3892 | -0.2827 | -5.6194 | ||
| 7.2 | -0.0276 | -0.1941 | -0.1693 | -5.5060 | ||
| 7.4 | 0.1711 | -0.0019 | -0.0796 | -5.4163 | ||
| T2 | 6.8 | -0.4226 | -0.3280 | -0.4188 | -5.7594 | |
| 7.0 | -0.2231 | -0.1312 | -0.2836 | -5.6243 | ||
| 7.2 | -0.0240 | 0.0638 | -0.1705 | -5.5111 | ||
| 7.4 | 0.1746 | 0.2561 | -0.0809 | -5.4216 | ||
| T3 | 6.8 | -0.4332 | -0.3337 | -0.4194 | -5.7600 | |
| 7.0 | -0.2338 | -0.1368 | -0.2843 | -5.6249 | ||
| 7.2 | -0.0346 | 0.0582 | -0.1711 | -5.5118 | ||
| 7.4 | 0.1640 | 0.2506 | -0.0816 | -5.4223 | ||
| T4 | 6.8 | -0.4269 | -0.3323 | -0.4190 | -5.7596 | |
| 7.0 | -0.2274 | -0.1355 | -0.2839 | -5.6245 | ||
| 7.2 | -0.0283 | 0.0596 | -0.1707 | -5.5113 | ||
| 7.4 | 0.1703 | 0.2519 | -0.0812 | -5.4218 |
| Site | Time | pH | si_Calcite | si_Siderite | si_Goethite | si_Fe(OH)3(a) |
|---|---|---|---|---|---|---|
| F2 | T1 | 6.8 | -0.5361 | -1.4085 | -0.5283 | -5.8690 |
| 7.0 | -0.3366 | -1.2115 | -0.3935 | -5.7341 | ||
| 7.2 | -0.1374 | -1.0161 | -0.2806 | -5.6213 | ||
| 7.4 | 0.0614 | -0.8234 | -0.1914 | -5.5320 | ||
| T2 | 6.8 | -0.5553 | -0.2146 | -0.5270 | -5.8637 | |
| 7.0 | -0.3558 | -0.0175 | -0.3920 | -5.7287 | ||
| 7.2 | -0.1566 | 0.1779 | -0.2789 | -5.6156 | ||
| 7.4 | 0.0421 | 0.3707 | -0.1895 | -5.5262 | ||
| T3 | 6.8 | -0.5643 | -0.1953 | -0.5271 | -5.8638 | |
| 7.0 | -0.3648 | 0.0018 | -0.3921 | -5.7288 | ||
| 7.2 | -0.1656 | 0.1972 | -0.2790 | -5.6157 | ||
| 7.4 | 0.0331 | 0.3900 | -0.1896 | -5.5263 | ||
| T4 | 6.8 | -0.5595 | -0.2007 | -0.5271 | -5.8637 | |
| 7.0 | -0.3600 | -0.0036 | -0.3920 | -5.7287 | ||
| 7.2 | -0.1608 | 0.1918 | -0.2790 | -5.6157 | ||
| 7.4 | 0.0379 | 0.3846 | -0.1896 | -5.5262 |
Mixing
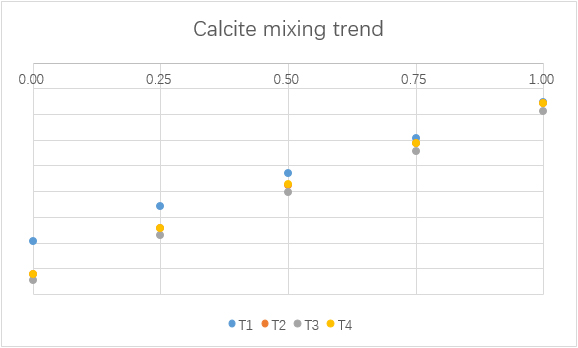
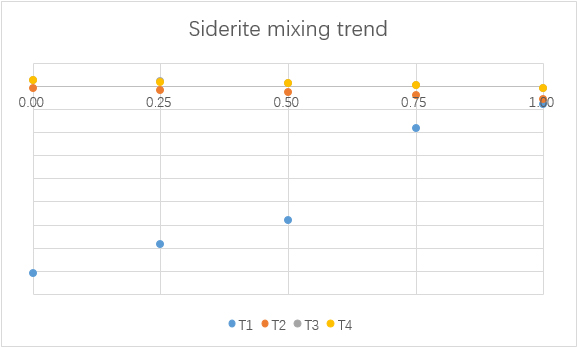
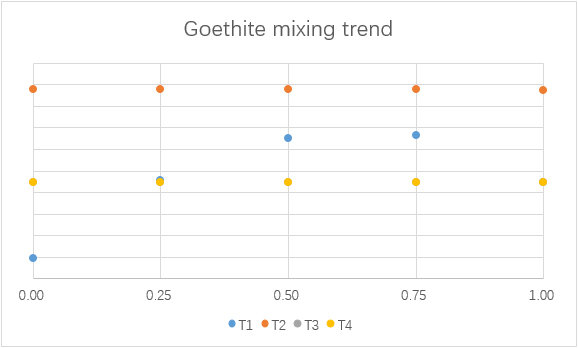
To understand the consequence of the mixing of water from F1 and F2, different simulations with different mixing ratios are made.
(For each graph, the x-axis is ratio of F1 to total mixing water.)
Modeling with aqion
Another computer modeling software called 'aqion' is also used. The results are as follows.
| Br7 | T1 | T2 | T4 | |
|---|---|---|---|---|
| pe | 8.08 | 2.07 | 2.09 | |
| Eh | mV | 454 | 116 | 117 |
| Fe | mg/L | 0.000273 | 0.5 | 0.48 |
| Fe(2) | mg/L | 5.31E-07 | 0.5 | 0.48 |
| Fe(3) | mg/L | 0.000273 | 0.000268 | 0.000269 |
| NH4 | mg/L | - | 0.12 | 0.14 |
| NO2 | mg/L | 0.404 | 0.26 | 0.26 |
| NO3 | mg/L | 0.916 | 5.85E-13 | 6.42E-13 |
| Fe(OH)3(a) | mg/L | 3.67 | 1.57 | 1.3 |
| Siderite | mg/L | 0 | 0 | 0 |
| CO2 | mmol/L | 0.77 | 0.76 | 0.77 |
| HCO3- | mmol/L | 4.59 | 4.53 | 4.6 |
| F1 | T1 | T2 | T3 | T4 | |
|---|---|---|---|---|---|
| pe | 2.03 | 1.84 | 1.83 | 1.83 | |
| Eh | mV | 114 | 103 | 103 | 103 |
| Fe | mg/L | 0.5 | 0.777 | 0.787 | 0.784 |
| Fe(2) | mg/L | 0.5 | 0.777 | 0.786 | 0.784 |
| Fe(3) | mg/L | 0.000278 | 0.000282 | 0.000282 | 0.000282 |
| NH4 | mg/L | - | - | - | - |
| NO2 | mg/L | - | - | - | - |
| NO3 | mg/L | - | - | - | - |
| Fe(OH)3(a) | mg/L | 0.172 | 0.172 | 0.0951 | 0.0377 |
| Siderite | mg/L | 0 | 0.256 | 0.236 | 0.241 |
| CO2 | mmol/L | 0.8 | 0.8 | 0.79 | 0.79 |
| HCO3- | mmol/L | 4.82 | 4.84 | 4.75 | 4.77 |
| F2 | T1 | T2 | T3 | T4 | |
|---|---|---|---|---|---|
| pe | 8.35 | 1.79 | 1.79 | 1.79 | |
| Eh | mV | 470 | 101 | 100 | 100 |
| Fe | mg/L | 0.000284 | 0.868 | 0.863 | 0.858 |
| Fe(2) | mg/L | 2.40E-07 | 0.868 | 0.863 | 0.858 |
| Fe(3) | mg/L | 0.000284 | 0.00028 | 0.000279 | 0.000279 |
| NH4 | mg/L | - | - | 0.15 | 0.15 |
| NO2 | mg/L | 0.033 | - | - | - |
| NO3 | mg/L | 0.316 | - | - | - |
| Fe(OH)3(a) | mg/L | 2.85 | 1.28 | 0.344 | 0.0951 |
| Siderite | mg/L | 0 | 0.856 | 0.99 | 0.958 |
| CO2 | mmol/L | 0.71 | 0.7 | 0.7 | 0.7 |
| HCO3- | mmol/L | 4.27 | 4.16 | 4.15 | 4.17 |
Data
The original data and softwares are contained in the folder and extra page materials.


